MyTherapy Partner Dashboard: Helping Pharma Understand What Resonated with Patients
Data helps pharma understand what resonates with patients and is crucial in defining the KPIs for digital patient support programs. Read why we offer a comprehensive data dashboard for every partner running programs on MyTherapy and how we provide additional data insights where necessary
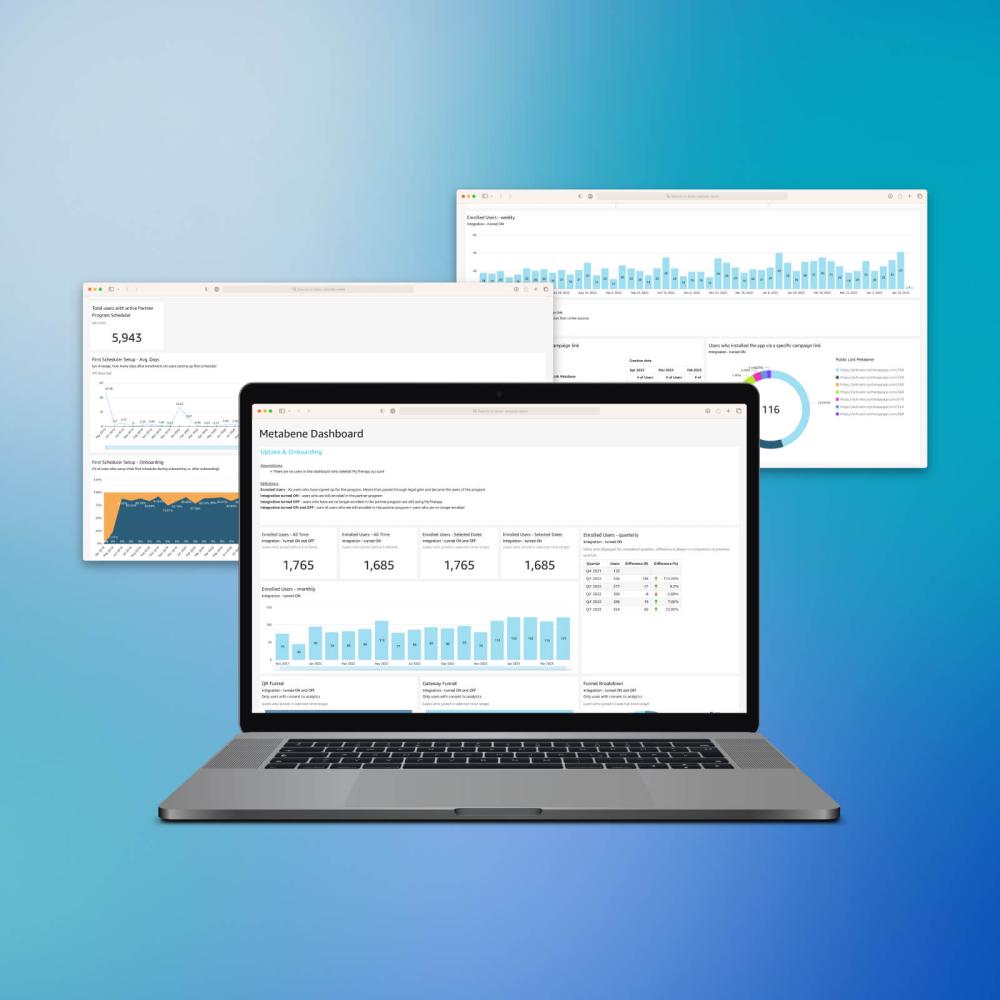
- Our pharma partners run a range of programs on MyTherapy, supporting patient communities taking different treatments in different therapeutic areas
- Data relating to topics such as Uptake & Onboarding, App Usage, and Schedulers & Adherence are relevant to practically any program running on MyTherapy, so these data points are the foundation of our out-of-the-box data dashboard
- Partners requiring additional insights can take advantage of our premium dashboard or specify the requirements for a tailored option
Our pharma partners run a diverse range of patient support programs on MyTherapy. Regardless of the treatment or therapeutic area in question, however, similar data points are typically necessary for pharma to understand a program’s success and gain insights into what resonates with patients. These data points form the foundation of our partner dashboard, which is part of our out-of-the-box program service for pharma. Beyond that, we offer a premium dashboard with additional insights, and, where necessary, we can build a fully tailored dashboard to meet specific needs.
How Our Partner Dashboard Helps Pharma Understand What Resonates with Patients
We have designed our dashboard to provide meaningful insights for pharma by helping our partners understand what resonates with patients. This can be interpreted in a few different ways: which features are delivering the most value to users? Which enrollment methods are the likeliest to increase uptake and retention? How do adherence rates develop over time?
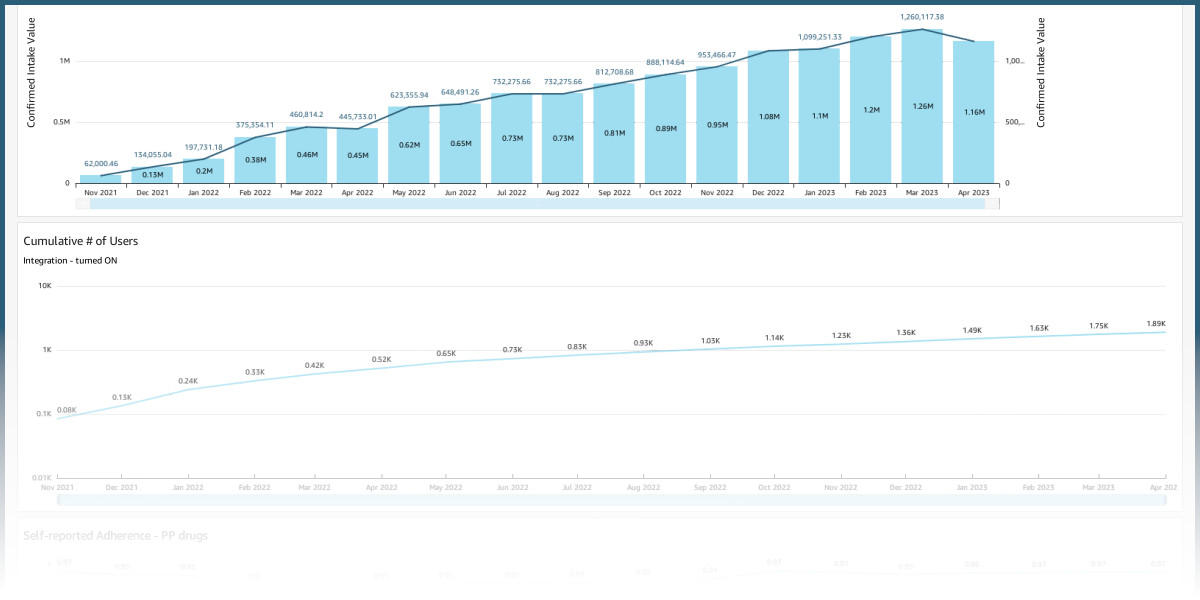
Addressing these questions was fundamental in the development of the dashboard, as they are universally applicable across the range of programs we provide our partners, regardless of the medication or therapeutic area in question.
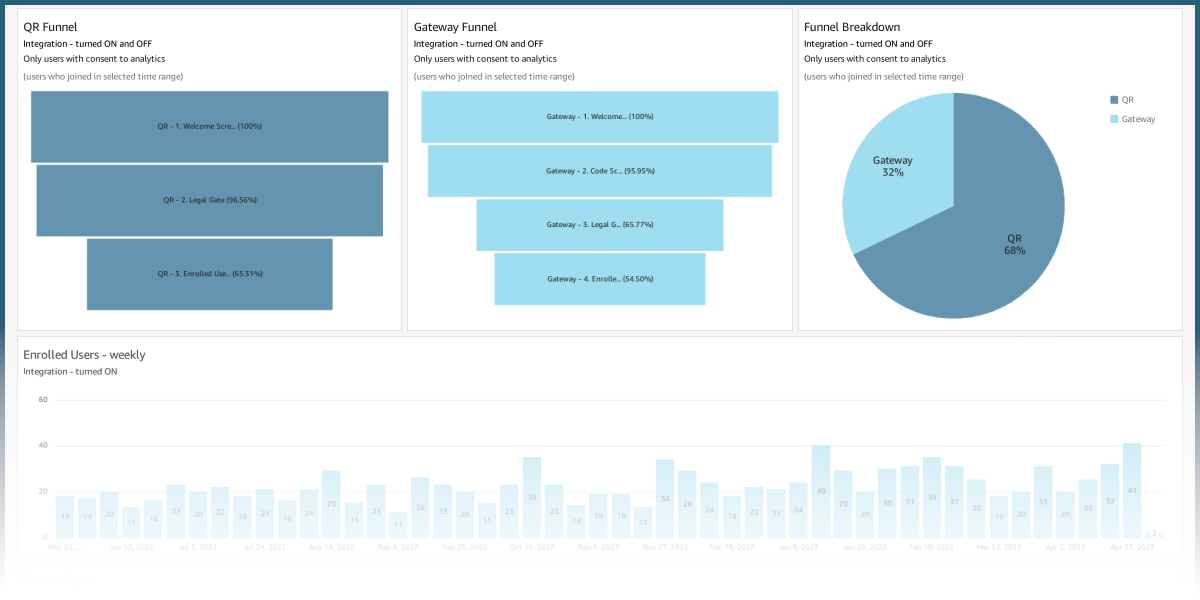
The result is a dashboard with data points separated into categories such as Uptake & Onboarding, App Usage, and Schedulers & Adherence. Within these categories, we have worked with partners to identify the most critical data points – and how they should be handled and presented – that provide the most value. Beyond helping us and our partners improve the programs running on MyTherapy, these data points act as KPIs for pharma and can serve as evidence of a positive RoI.
Digging Deeper with the Premium Dashboard
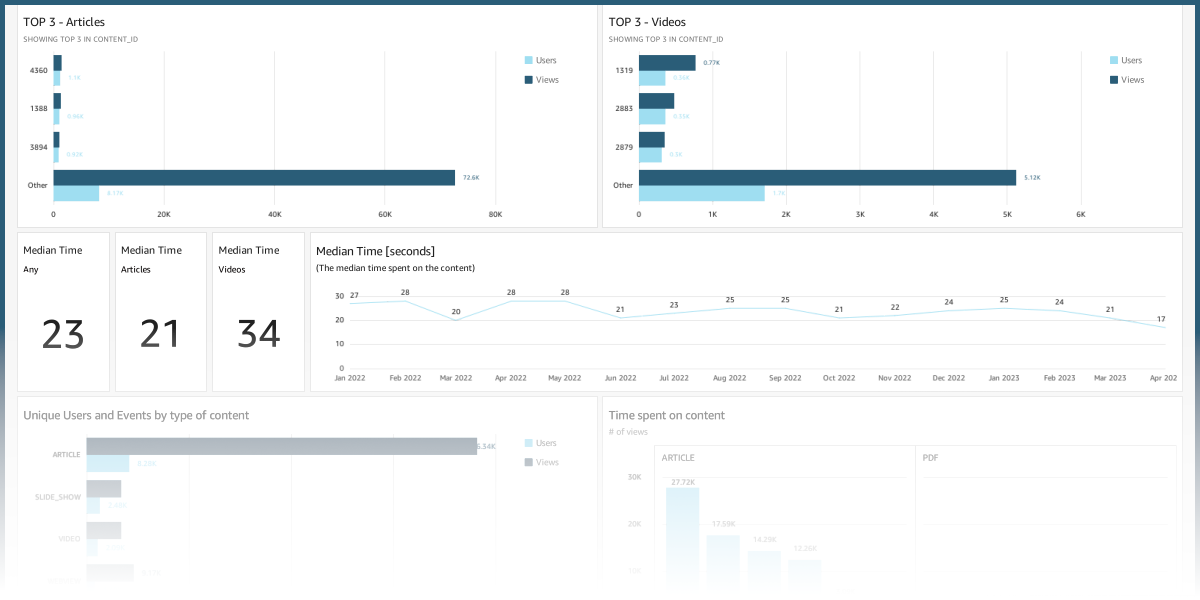
For some programs, partners require additional insights. For example, content plays a big role in some programs, particularly those aimed at educating and informing patient populations. In these cases, we can offer additional data points.
Within the content analytics category, we can reveal which content formats resonate with patients and which topics generate engagement. When combined with other data sets, content analytics can reveal whether a particular campaign had a desired impact (e.g., do users who engage with content demonstrate different behavioral patterns to those who do not).
Delivering a Tailored Experience
While our regular and premium dashboards meet the requirements of many of our pharma partners, some programs require a more tailored approach. This can involve making small tweaks to the existing dashboards or a more in-depth customization, it all depends on the specific requirements of the partner and the nature of the program in question. Regardless, the possibility for a tailored dashboard exists for any partner, and our in-house data science team is on-hand to work on delivering meaningful and insightful data.
If you are interested in running a patient support program on our MyTherapy platform and are interested in learning how our dashboards help you understand what resonates with patients, provide KPIs, and support the business case for patient engagement, click here to book a meeting.

